


 - Government of India")
 - Government of India")
")


")


MAGNITUDE OF THE PROBLEM
BackMAGNITUDE OF THE PROBLEM
Malaria is a public health problem in several parts of the country. About 95% population in the country resides in malaria endemic areas and 80% of malaria reported in the country is confined to areas consisting 20% of population residing in tribal, hilly, difficult and inaccessible areas. Directorate of National Vector Borne Disease Control Programme (NVBDCP) has framed technical guidelines/ policies and provides most of the resources for the programme. Indicators have been developed at national level for monitoring of the programme and there is uniformity in collection, compilation and onward submissions of data. Passive surveillance of malaria is carried out by PHCs, Malaria Clinics, CHCs and other secondary and tertiary level health institutions that patients visit for treatment. Apart from that, ASHA- a village volunteer is involved in the programme to provide diagnostic and treatment services at the village level as a part of introduction of intervention like Rapid Diagnostic Tests and use of Artemisinin Combination Therapy (ACT) for the treatment of Pf cases.
The countrywide malaria situation as reflected in surveillance data from 1995-2022 is given in the following Table: 1.
Table 1: Countrywide Epidemiological Situation (1995 – 2022)
| Years | Pop. In (000) | Total Malaria Cases (Million) | P.Falciparum Cases (Million) | PF% | API | Deaths Due to Malaria |
| 1995 | 888143 | 2.93 | 1.14 | 38.84 | 3.29 | 1151 |
| 1996 | 872906 | 3.04 | 1.18 | 38.86 | 3.48 | 1010 |
| 1997 | 884719 | 2.66 | 1.01 | 37.87 | 3.01 | 879 |
| 1998 | 910884 | 2.22 | 1.03 | 46.35 | 2.44 | 664 |
| 1999 | 948656 | 2.28 | 1.14 | 49.96 | 2.41 | 1048 |
| 2000 | 970275 | 2.03 | 1.05 | 51.54 | 2.09 | 932 |
| 2001 | 984579 | 2.09 | 1.00 | 48.20 | 2.12 | 1005 |
| 2002 | 1013942 | 1.84 | 0.90 | 48.74 | 1.82 | 973 |
| 2003 | 1027157 | 1.87 | 0.86 | 45.85 | 1.82 | 1006 |
| 2004 | 1040939 | 1.92 | 0.89 | 46.47 | 1.84 | 949 |
| 2005 | 1082882 | 1.82 | 0.81 | 44.32 | 1.68 | 963 |
| 2006 | 1072713 | 1.79 | 0.84 | 47.08 | 1.66 | 1707 |
| 2007 | 1087582 | 1.51 | 0.74 | 49.11 | 1.39 | 1311 |
| 2008 | 1119624 | 1.53 | 0.78 | 50.81 | 1.36 | 1055 |
| 2009 | 1150113 | 1.56 | 0.84 | 53.72 | 1.36 | 1144 |
| 2010 | 1167360 | 1.60 | 0.83 | 52.15 | 1.37 | 1018 |
| 2011 | 1194901 | 1.31 | 0.67 | 50.74 | 1.10 | 754 |
| 2012 | 1211509 | 1.07 | 0.53 | 49.98 | 0.88 | 519 |
| 2013 | 1221640 | 0.88 | 0.46 | 52.61 | 0.72 | 440 |
| 2014 | 1234995 | 1.10 | 0.72 | 65.55 | 0.89 | 562 |
| 2015 | 1265173 | 1.17 | 0.78 | 66.61 | 0.92 | 384 |
| 2016 | 1283303 | 1.09 | 0.71 | 65.44 | 0.85 | 331 |
| 2017 | 1315092 | 0.84 | 0.53 | 62.70 | 0.64 | 194 |
| 2018 | 1337617 | 0.43 | 0.21 | 48.19 | 0.32 | 96 |
| 2019 | 1349006 | 0.34 | 0.16 | 46.36 | 0.25 | 77 |
| 2020 | 1372316 | 0.19 | 0.12 | 63.84 | 0.14 | 93 |
| 2021 | 1385500 | 0.16 | 0.10 | 62.79 | 0.12 | 90 |
| 2022 | 1396937 | 0.18 | 0.10 | 57.26 | 0.13 | 83 |
(P)=Provisional
The case load, though steady around 2 million cases annually in the late nineties, has shown a declining trend since 2002. When interpreting API, it is important to evaluate the level of surveillance activity indicated by the annual blood examination rate. At low levels of surveillance, the Slide Positivity Rate (SPR) may be a better indicator. The SPR (not shown in table) has also shown gradual decline from 3.50 in 1995 to 0.19 in 2020. The reported Pf cases declined from 1.14 million in 1995 to 0.12 million cases in 2020. The Pf % has gradually increased from 39% in 1995 to 63.84% in 2020.
Number of reported deaths has been levelling around 1000 per year. The mortality peak in 2006 was related to severe malaria epidemics affecting Assam caused by population movements.
Country Scenario of Epidemiological Indicators for Malaria
The data in following Table 2 shows that Annual Parasite Incidence (API) rate has consistently come down from 2.12 per thousand in 2001 to 0.25 per thousand in 2019 but confirmed deaths due to malaria have been continusouly down during this period between 1707 and 77. The table below shows the information on indicators by which malaria prevention/ control activity in India are monitored and evaluated. Slide Positivity Rate (SPR) and Slide falciparum Rate (SfR) have reduced over the years 2001-2019.
Table 2: Epidemiological Indicators for Malaria in India (2001-2022)
| Year | Population (in '000) |
Blood Smear Examined | Positive cases | Pf Cases | ABER | API | SPR | SFR | Deaths |
| 2001 | 984579 | 90,389,019 | 2,085,484 | 1,005,236 | 9.18 | 2.12 | 2.31 | 1.11 | 1005 |
| 2002 | 1013942 | 91,617,725 | 1,841,229 | 897,446 | 9.04 | 1.82 | 2.01 | 0.98 | 973 |
| 2003 | 1027157 | 99,136,143 | 1,869,403 | 857,101 | 9.65 | 1.82 | 1.89 | 0.86 | 1006 |
| 2004 | 1040939 | 97,111,526 | 1,915,363 | 890,152 | 9.33 | 1.84 | 1.97 | 0.92 | 949 |
| 2005 | 1082882 | 104,143,806 | 1,816,569 | 805,077 | 9.62 | 1.68 | 1.74 | 0.77 | 963 |
| 2006 | 1072713 | 106,725,851 | 1,785,129 | 840,360 | 9.95 | 1.66 | 1.67 | 0.79 | 1707 |
| 2007 | 1087582 | 94,928,090 | 1,508,927 | 741,076 | 8.73 | 1.39 | 1.59 | 0.78 | 1311 |
| 2008 | 1119624 | 97,316,158 | 1,526,210 | 775,523 | 8.69 | 1.36 | 1.57 | 0.80 | 1055 |
| 2009 | 1150113 | 103396076 | 1563,574 | 839,877 | 8.99 | 1.36 | 1.51 | 0.81 | 1144 |
| 2010 | 1167360 | 106040223 | 1495817 | 779549 | 9.21 | 1.37 | 1.41 | 0.74 | 1018 |
| 2011 | 1194901 | 109313294 | 1310656 | 665004 | 9.12 | 1.10 | 1.20 | 0.61 | 754 |
| 2012 | 1211580 | 109048884 | 1067824 | 533695 | 9.00 | 0.88 | 0.98 | 0.49 | 519 |
| 2013 | 1221640 | 113445106 | 881730 | 463846 | 9.26 | 0.72 | 0.78 | 0.41 | 440 |
| 2014 | 1234995 | 124066331 | 1102205 | 722546 | 10.05 | 0.89 | 0.89 | 0.58 | 562 |
| 2015 | 1265173 | 121141970 | 1169261 | 778821 | 9.58 | 0.92 | 0.97 | 0.64 | 384 |
| 2016 | 1283303 | 124933348 | 1085823 | 711502 | 9.74 | 0.85 | 0.87 | 0.57 | 331 |
| 2017 | 1315092 | 125977799 | 844558 | 529530 | 9.58 | 0.64 | 0.67 | 0.42 | 194 |
| 2018 | 1337617 | 124475724 | 429928 | 207198 | 9.31 | 0.32 | 0.35 | 0.17 | 96 |
| 2019 | 1349006 | 134230349 | 338494 | 156940 | 9.95 | 0.25 | 0.25 | 0.12 | 77 |
| 2020 | 1372316 | 97177024 | 186532 | 119088 | 7.08 | 0.14 | 0.19 | 0.12 | 93 |
| 2021 | 1385500 | 114391977 | 161753 | 101566 | 8.26 | 0.12 | 0.14 | 0.09 | 90 |
| 2022 | 1396937 | 152083001 | 176522 | 101068 | 10.89 | 0.13 | 0.12 | 0.07 | 83 |
BSE : Blood Smear Examined P=Provisonal
ABER : Annual Blood Smear Examination Rate (percentage of blood smears examined in a year of total population)
Fig 1: Trend of Malaria Cases And Deaths 2001-2022
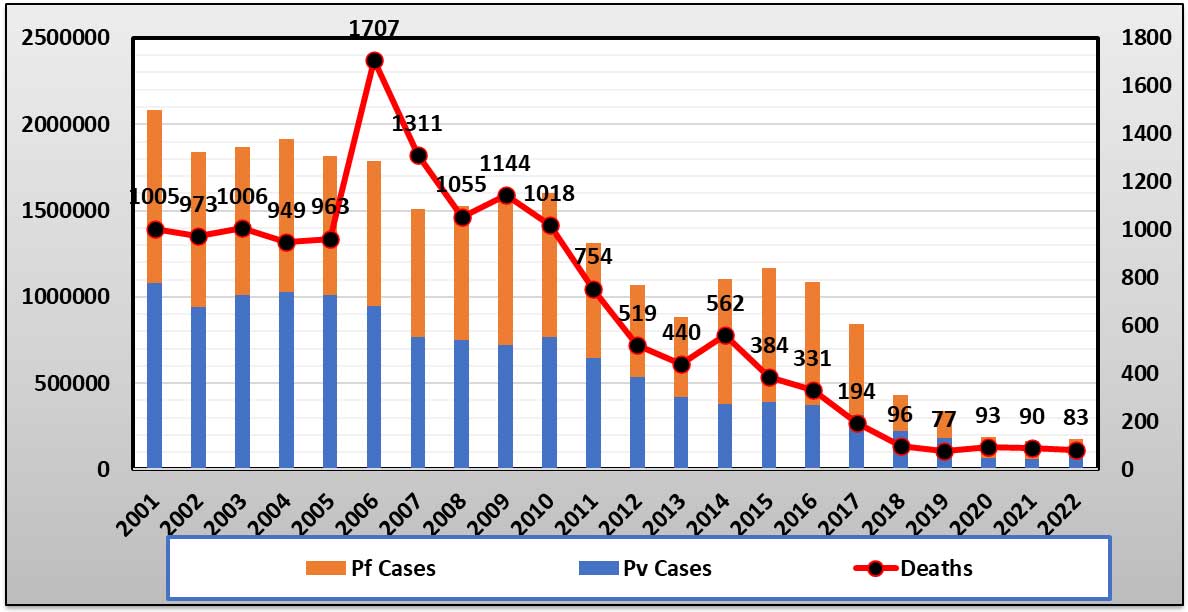
Fig 1 shows that the cases have consistently declined from 2.09 million to 0.19 million during 2001 to 2020. Similarly Pf cases have declined from 1.0 to 0.12 million cases during the same period. Less than 2000 deaths were reported during all the years within this period with a peak in 2006 when an epidemic was reported in NE States. The country SPR has declined from 2.31 to 0.19 and SFR has declined from 1.11 in 2001 to 0.12 in 2020. This indicates declining overall endemicity of malaria in the country.


